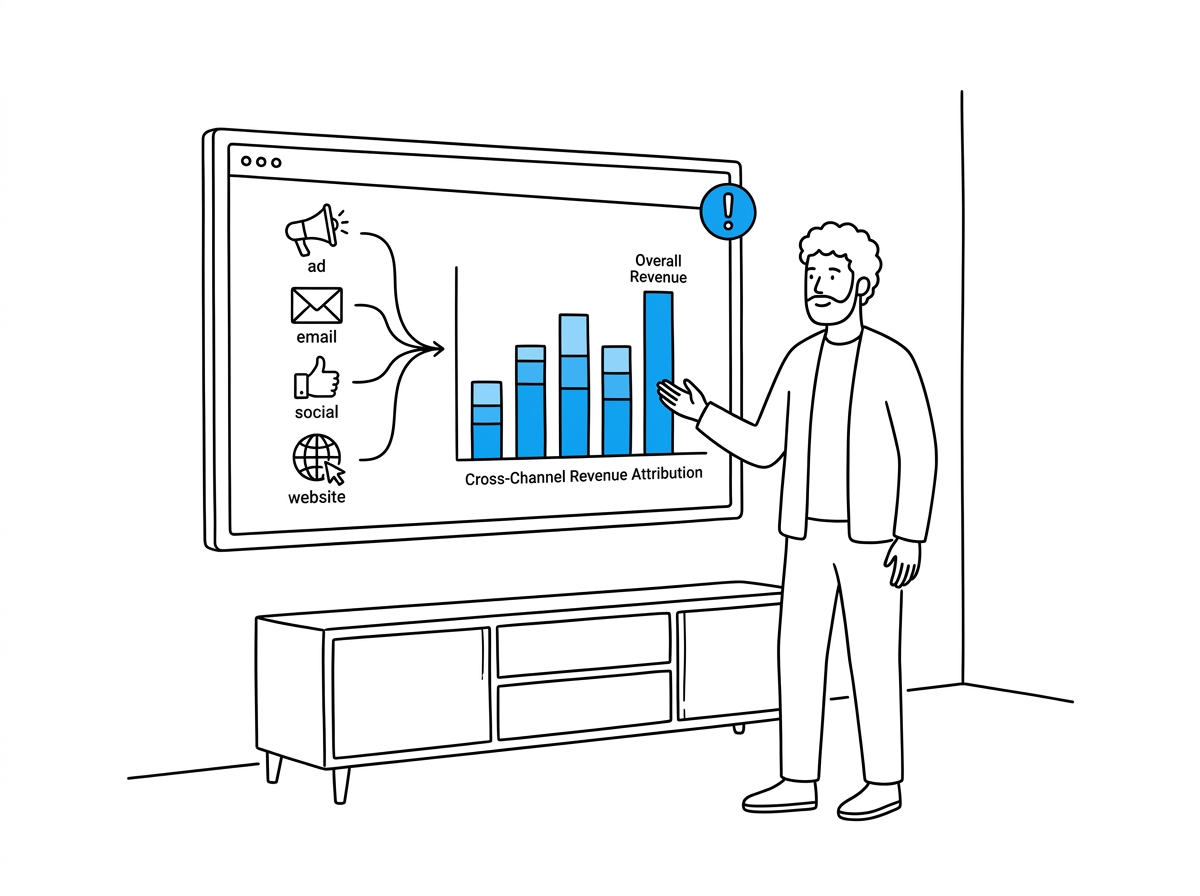
Most ecommerce teams don't have a data problem. They have too much data spread across ad platforms, Shopify, email tools, and a CRM, and no fast way to turn it into a decision. A merchant running six channels can generate 15+ dashboards and still not know which channel actually drove yesterday's revenue. That gap between "we have the numbers" and "we know what to do" is exactly what AI analytics for ecommerce is built to close: pulling fragmented data into one model that flags what changed, why, and what to do next, in minutes instead of a full day of spreadsheet work.
How Concat Pro Handles AI Analytics for Ecommerce
Concat Pro's Data Agent is built for this exact gap. It connects analytics platforms, ad channels, CRM data, your website, and creator campaigns into one place, then feeds what it finds back into the rest of your stack — SEO/GEO, Website, Creator, and Brand agents — so every team works off the same numbers instead of five conflicting exports. In practice this covers five recurring jobs: channel impact analysis (ranking which channels actually move revenue), automated executive reporting, performance anomaly detection, growth opportunity discovery, and revenue/funnel analysis. One connected Data Agent workspace we reviewed had analyzed 12 connected data sources and surfaced a specific $1,323 (+4.09%) revenue opportunity the team hadn't flagged manually — the kind of line item that's easy to miss across a dozen disconnected reports. For teams that also need to find which creators or channels to test next, Concat Pro's Rank surfaces top influencers and channels by industry and platform as a starting point for outreach, and the Growth Rate Calculator benchmarks your month-over-month or CAGR growth against the 10-20% annual range typical for ecommerce, so you know if a channel's lift is actually above baseline.
Case Study: Origin Adds $450K in Revenue by Analyzing Attribution in Minutes, Not Hours
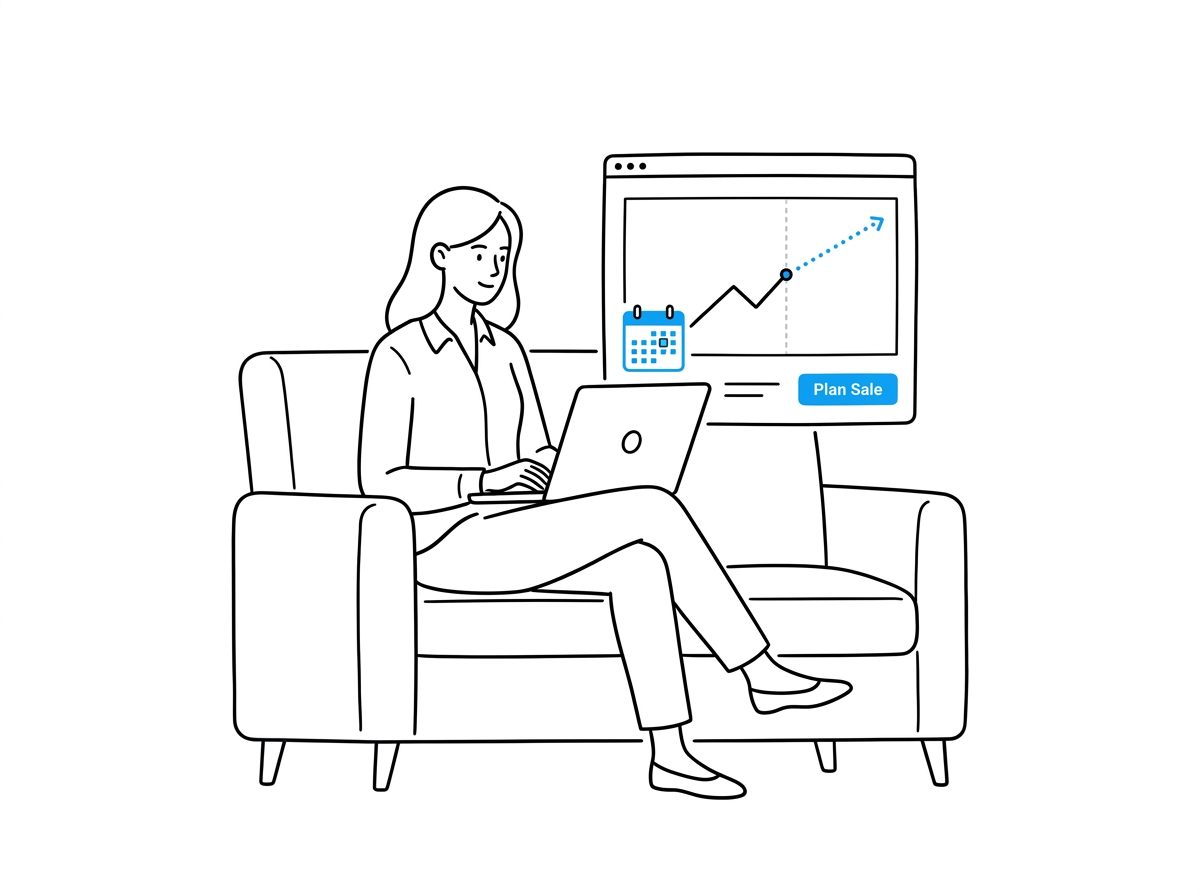
Origin, an outdoor apparel brand with roughly 1 million social followers, adopted Triple Whale's Moby AI in March 2024 specifically to stop losing hours to manual attribution pulls. The AI layer identifies more site visitors and feeds that signal into Klaviyo flows, generating 15-20% more triggered events on top of the brand's existing stack. The compounding result: over $450,000 in incremental revenue within a year, a 100% year-over-year increase in ad spend without losing efficiency, and roughly 40% time savings for the BI team. Director of Ecommerce Justin Parker put it plainly: "Questions that used to take me 30+ minutes of manual analysis now take five minutes or less." The team also used AI-driven correlation analysis between ad spend and direct traffic to guide budget shifts, and ran a 4-day sale revenue forecast in five minutes flat — a task that previously ate an afternoon. One added detail that shows why AI attribution matters: an email Klaviyo credited with $118,000 in revenue turned out to be worth only $44,000 once other touchpoints were properly weighted in the unified model.

Case Study: Omnilux Sees a 659% ROAS Lift From Better Attribution Modeling
Skincare brand Omnilux ran into a common ecommerce analytics platform blind spot: click-only attribution was undercounting Pinterest's real contribution to revenue. Switching to Northbeam's "Clicks + Deterministic Views" model — which credits view-driven conversions, not just clicks — changed the picture completely: a 659% lift in ROAS, a 728% increase in tracked transactions, and a 671% increase in attributed revenue on the same ad spend. Nothing about Pinterest's performance changed; the measurement did. That's the risk of running ecommerce analytics tools that only count clicks: budget gets pulled from channels that are quietly working.
Manual Reporting vs. AI Analytics for Ecommerce
| Task | Manual Process | AI Analytics Platform |
|---|---|---|
| Cross-channel revenue report | 2-4 hours pulling exports weekly | Live dashboard, always current |
| Attribution accuracy | Last-click or first-click only | Multi-touch, view + click weighted |
| Anomaly detection | Noticed days later, if at all | Flagged same day |
| Forecasting a sale/promo | Manual model, hours of work | Minutes, based on live data |
| Executive reporting | Manually assembled slides | Auto-generated narrative report |
Common Mistakes Teams Make With Ecommerce Analytics Tools
- Trusting last-click attribution. It systematically undercounts upper-funnel channels like video and social, as Omnilux's Pinterest data shows.
- Treating every dashboard number as gospel. Klaviyo's own attribution overstated one campaign by $74,000 versus a unified model — cross-check platform-native numbers.
- Skipping anomaly alerts. A 3-day lag on catching a tracking break or CPM spike can cost more than the fix.
- Benchmarking growth against nothing. Use a real baseline, like the 10-20% annual ecommerce growth range, instead of judging performance in a vacuum.
For a closer look at how AI-driven attribution and reporting actually get built out, this recent walkthrough on the AI stack behind modern ecommerce operations is a useful watch:
The Bottom Line
AI analytics for ecommerce isn't about adding another dashboard — it's about collapsing the time between "something changed" and "here's what to do about it." Origin cut analysis time from 30 minutes to five. Omnilux found 659% more ROAS that was already there, just miscounted. If your team is still stitching together exports every Monday morning, that's the gap worth closing first. Explore Concat Pro's related growth analytics coverage or see how AI personalization and AI customer service fit into the same connected data loop.
References
- Concat Pro — Data Agent
- Triple Whale — Origin Case Study
- Northbeam — How Omnilux Drove a 659% ROAS Lift on Pinterest